

Texans Pay More in Taxes Than It Costs to Govern Texas
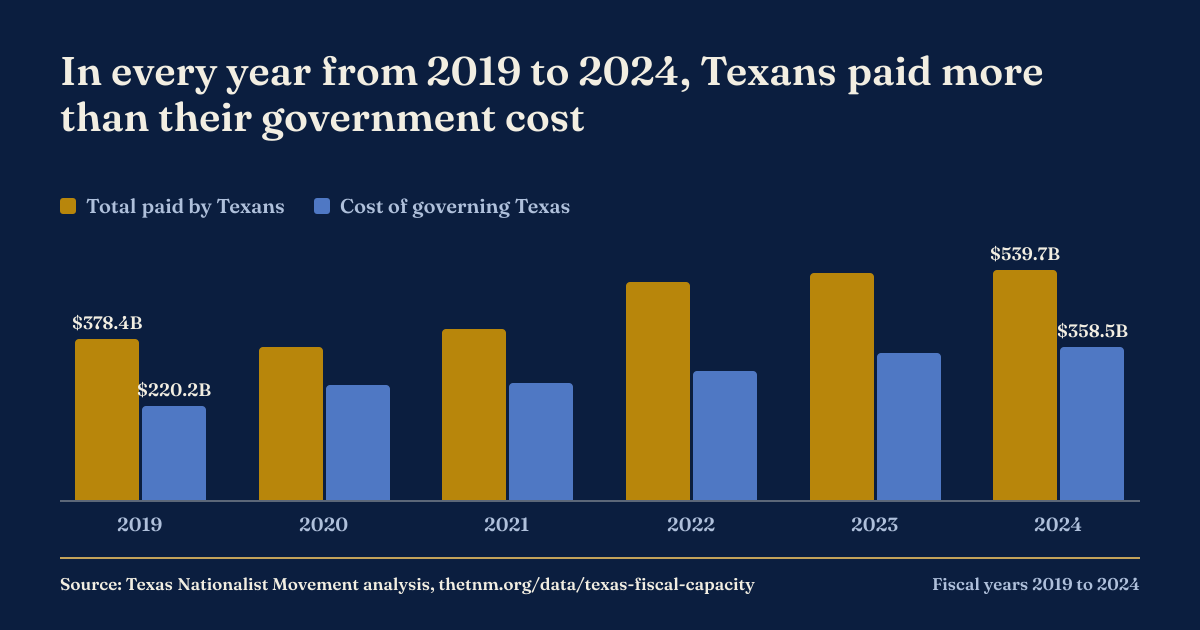
From 2019 through 2024, Texans paid an average of $453.5 billion a year in federal and state taxes. Running federal and state government inside Texas cost an average of $295.3 billion a year. Taxes paid ran ahead of that cost in every one of the six years, the pandemic years included.
$453.5B
paid a year, against $295.3B in cost
In every year from 2019 to 2024, Texans paid more than their government cost
How to Cite
Source: Texas Nationalist Movement analysis, thetnm.org/data/texas-fiscal-capacity
Reporters and researchers may republish this chart and these figures with that line and a link to this page. For questions about the method, or an interview, write media@thetnm.org.
Method
The question is fiscal capacity: whether Texans, taxed as they are taxed now, already pay enough to fund government at the level they receive it now. It is not a balance-of-payments count of what Washington sends back.
Taxes paid are federal taxes collected from Texas, as reported in Table 5 of the IRS Data Book, plus Texas state taxes and fees, excluding federal funds, as reported by the Texas Comptroller.
Cost starts with total federal spending in Texas from the Rockefeller Institute of Government. It then removes Social Security, Medicare, veterans' cash benefits and federal pensions, which people collect wherever they live, and one-time COVID relief. State-funded spending is added back. What remains is the federal and state cost of governing Texas.
The gap between the two lines is not a surplus to bank. About $120 billion of what Texans pay is the payroll tax behind Social Security and Medicare. Take it off the revenue side to match the benefits taken off the cost side, and Texans pay about $333 billion for a government that costs about $295 billion. Under every consistent accounting the report tested, Texas lands within about $30 billion of break-even. The finding is self-sufficiency.
IRS gross collections are assigned to a state by the filer's address, so a corporation's taxes are counted where it files. The 2024 federal spending figure is an estimate, because the Rockefeller Institute had not published that year when the report was built.
The Data
| Year | Federal taxes | State taxes and fees | Total paid | Federal spending in Texas | Less portable benefits | Less COVID relief | State-funded spending | Cost of governing |
|---|---|---|---|---|---|---|---|---|
| 2019 | 292.3 | 86.0 | 378.4 | 286.8 | 148.5 | 0.0 | 81.9 | 220.2 |
| 2020 | 275.5 | 83.5 | 358.9 | 456.2 | 155.2 | 115.8 | 84.5 | 269.7 |
| 2021 | 312.1 | 88.6 | 400.6 | 492.5 | 165.0 | 131.1 | 79.3 | 275.7 |
| 2022 | 400.9 | 110.6 | 511.5 | 429.3 | 178.8 | 32.8 | 86.1 | 303.8 |
| 2023 | 413.0 | 119.1 | 532.1 | 458.6 | 199.2 | 16.7 | 101.2 | 343.9 |
| 2024 | 417.4 | 122.3 | 539.7 | ~465.0 | 214.5 | ~8.0 | 116.0 | 358.5 |
| Average | 351.9 | 101.7 | 453.5 | 431.4 | 176.9 | 50.7 | 91.5 | 295.3 |
$ billions. The two "less" columns are subtracted from federal spending. "~" marks an estimate: the 2024 Rockefeller figure had not been published when the report was built, and the 2024 COVID relief line follows from it. Averages are computed from unrounded source data, so printed cells may not sum exactly.
Sources
- Texas Nationalist Movement, Can Texas Make It? A 2026 Reassessment (August 2026)
- IRS, SOI Tax Stats, IRS Data Book, Table 5 (gross collections by state), FY2019 to FY2024
- Rockefeller Institute of Government, Balance of Payments (federal spending by state)
- Texas Comptroller of Public Accounts, Annual Cash Report
- Social Security Administration, CMS, VA and OPM benefit series (the carve-outs)
- Can Texas Make It?, full source list and appendices
Read the Argument
More TNM Data
- Texans' Share of Federal Interest Has More Than Doubled Since 2019
- Texas Paid the Second-Most Federal Taxes of Any State in Fiscal 2025
- Texas Would Rank Eighth Among the World's Economies
- One Dollar in Five in Texas State Politics Came From Outside Texas This Cycle
Published October 23, 2026 by the Texas Nationalist Movement.